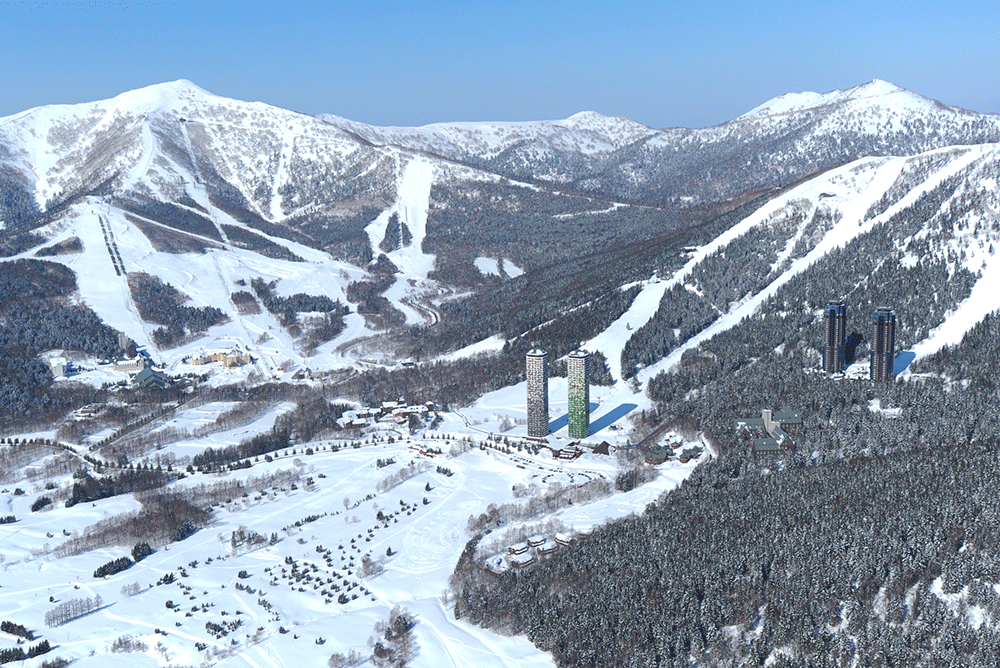
Hoshino Resorts Tomamu consists of two mountains: Tomamu Mountain, which spreads out over the 1,239m-high Mt. Tomamu, and Tower Mountain to the east, and has a total of 29 courses spread across its vast fields. The resort has made a "Winter Mountain Opening Declaration" to allow people to freely ski in Hokkaido's pristine natural environment, and has set up an "Advanced Ski Area" within the resort where you can enjoy tree runs, powder snow, and other terrain in its original state
In fact, a unique study that has a connection to the present was carried out at Hoshino Resorts Tomamu in 2012. The researcher was Yoshimura Nobuhiko, a researcher in forest management and map information utilization, and former coordinator at the Graduate School of Environmental Science, Hokkaido University. We will introduce the aims of Yoshimura's research, what he learned from it, and what the results led to
Research objectives
In simple terms, Mr. Yoshimura's research involved attaching GPS devices to users and snow groomers, collecting their skiing log data, and analyzing the results.
Why did he decide to start this research?
"I wondered if we could do some interesting thinning of trees within the Tomamu resort for skiers and snowboarders. That was the idea for the research. I thought that having empirical data to support my proposals for creating more attractive courses, including the possibility of thinning, would be stronger.
Actually, my biggest motivation was that I wanted to have more fun tree runs myself (laughs). I hoped that this research would allow me to reaffirm the appeal of the resort and discover potentially promising areas that I hadn't noticed before."
Yoshimura, who says this, is actually a core snowboarder who rides the slopes 100 days a year.
The research set the goals and the three things they worked on were these. To get closer to these, they needed riding logs.
[Three Initiatives]
Snow grooming: Creating a method that balances enhanced appeal and energy conservation (grooming locations x user skiing tracks)
Maps: Expanding the range of appeal with information (current information provision x user skiing tracks and interview results)
Forest management: Proposing forest management methods for skiing areas (tree density x user skiing tracks)
Research findings and analysis
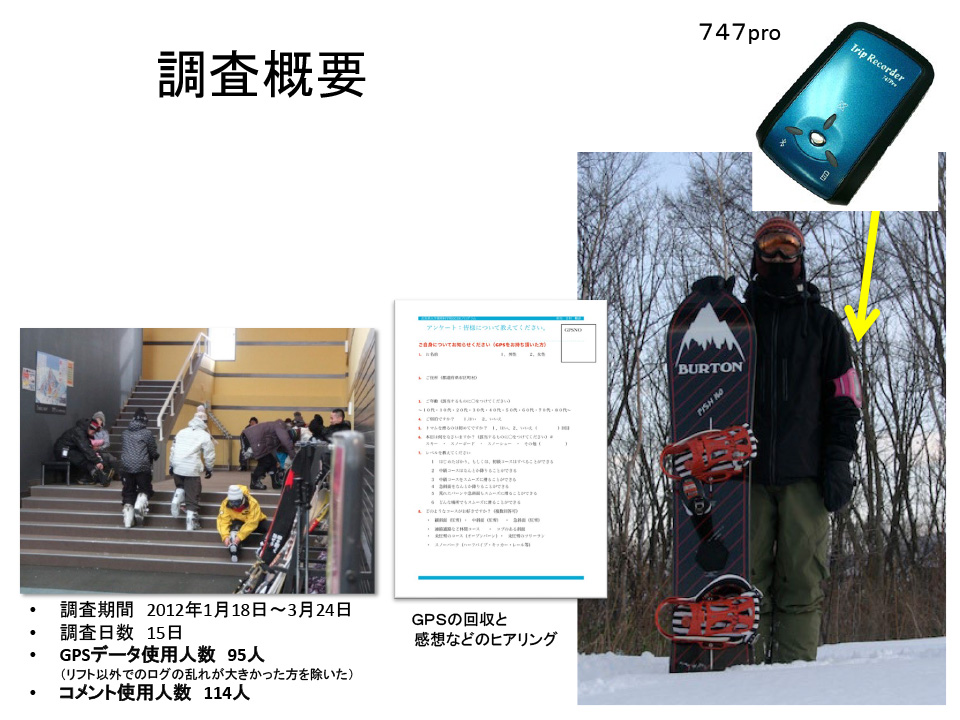
The research study involved the following:
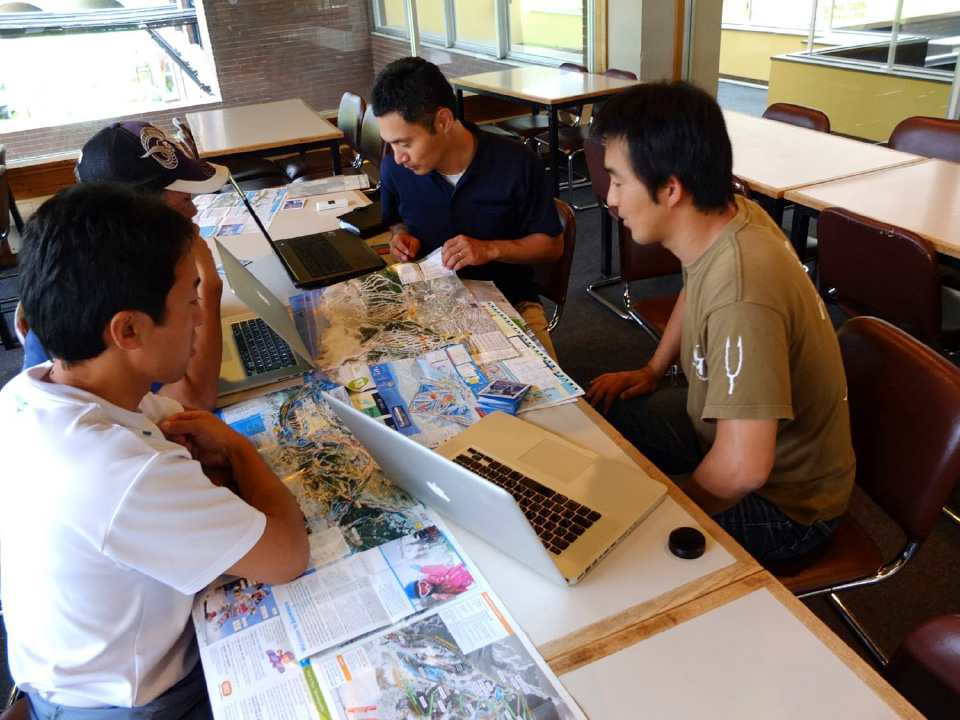
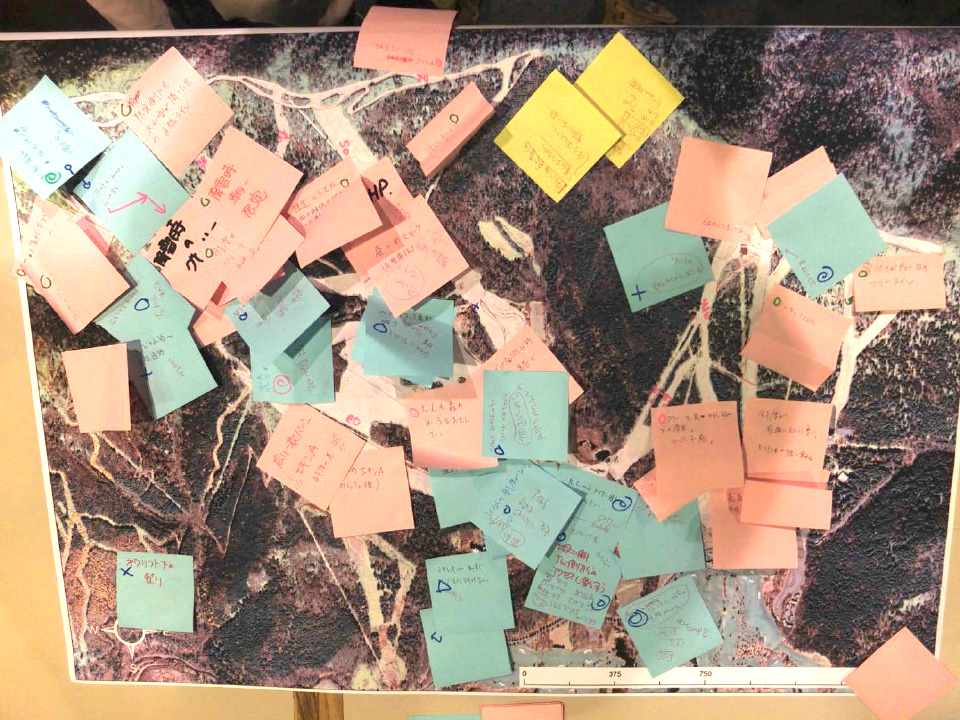
Between January and March 2012, 95 users who visited Hoshino Resorts Tomamu were fitted with GPS devices over a 15-day period, and 114 were interviewed. The study then comprehensively analyzed the digital data (skiing logs) and the analog data (skiers' impressions).
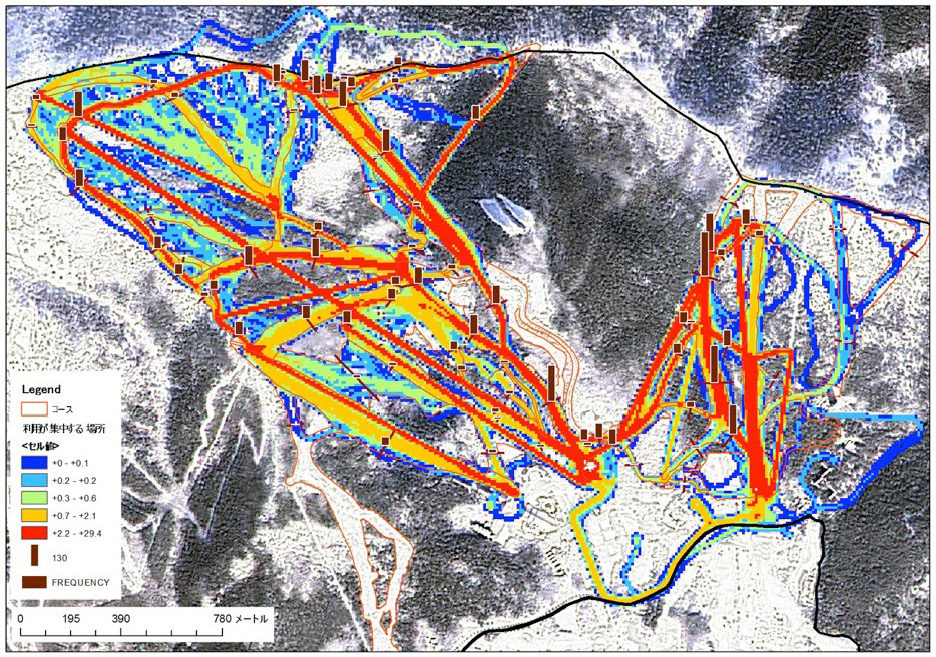
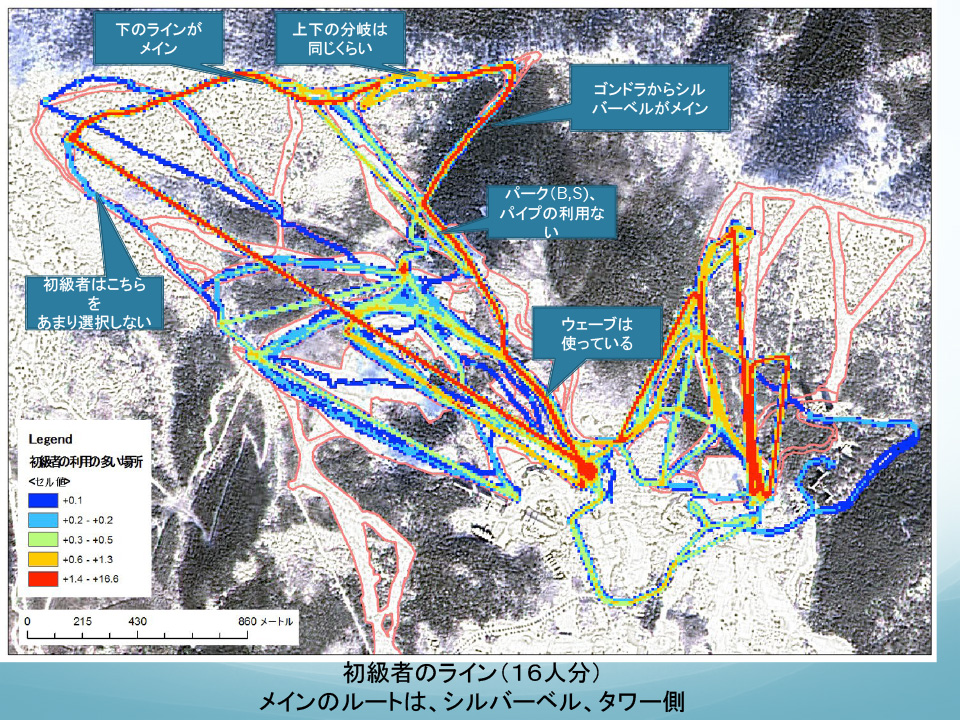
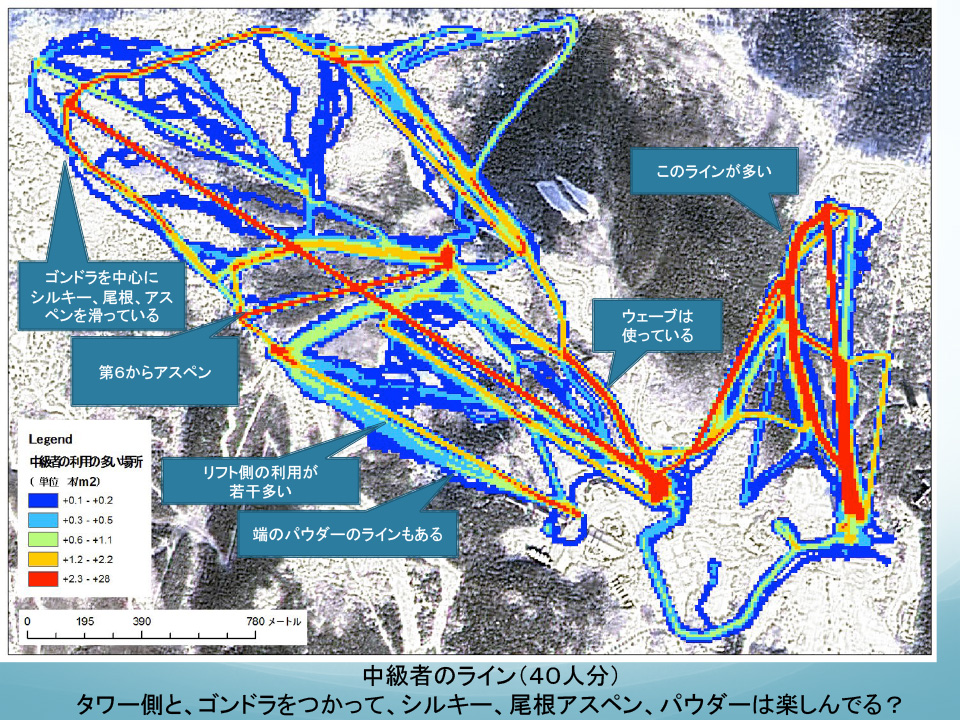
By using GPS to record run logs, it becomes clear how users are skiing, including how much each run is being skied, how fast they are skiing, and so on
For example, this analysis map shows usage. Red areas are areas with high usage, and blue areas are areas with low usage. The brown bar graph shows the number of times each course is used. This makes it clear at a glance how much usage there is on each part of the slope
(Tower Mt. is on the right, Tomamu Mt. is on the left)
Use GPS data to change routes and greatly improve convenience!
A resort center with schools and rentals has been located on Tomamu Mountain for a long time, but at the time, beginners could not access the resort center by lift. Guest satisfaction surveys had also mentioned the inconvenience of having to travel by bus, and the site was aware of this. Despite this situation, this survey revealed that many beginner and intermediate skiers were skiing Tower Mountain for the first time
The data made the problems they had visible, confirmed what they had been thinking on the ground, and provided a powerful impetus for improving the user environment. They moved childcare, school, rental facilities, and other facilities to Tower Mountain. By aligning guest flow with actual movement, they were able to greatly improve convenience
Since then, improvements have been made when the lifts have been replaced and the slopes constructed, and now even beginners can access the resort center by lift. Needless to say, the survey data from that time was put to good use
Eliminate your frustration by adding a slope to the long, flat part at the bottom!
GPS can also measure speed, so the skiing log can tell you what speed people are skiing at on which parts of the slope. The company's in-house customer satisfaction measurement system revealed that a common complaint in user satisfaction surveys at the time was that skis would stop on the long, flat sections at the bottom of the slope
By creating waves or slopes in areas where the glide speed drops, it is possible to maintain speed. Based on the data from the glide log, civil engineering work was carried out to create slopes in the areas where the glide speed was slowing down. This dramatically improved the problem and resolved user complaints. Civil engineering work is expensive, so the data was extremely useful in making this decision
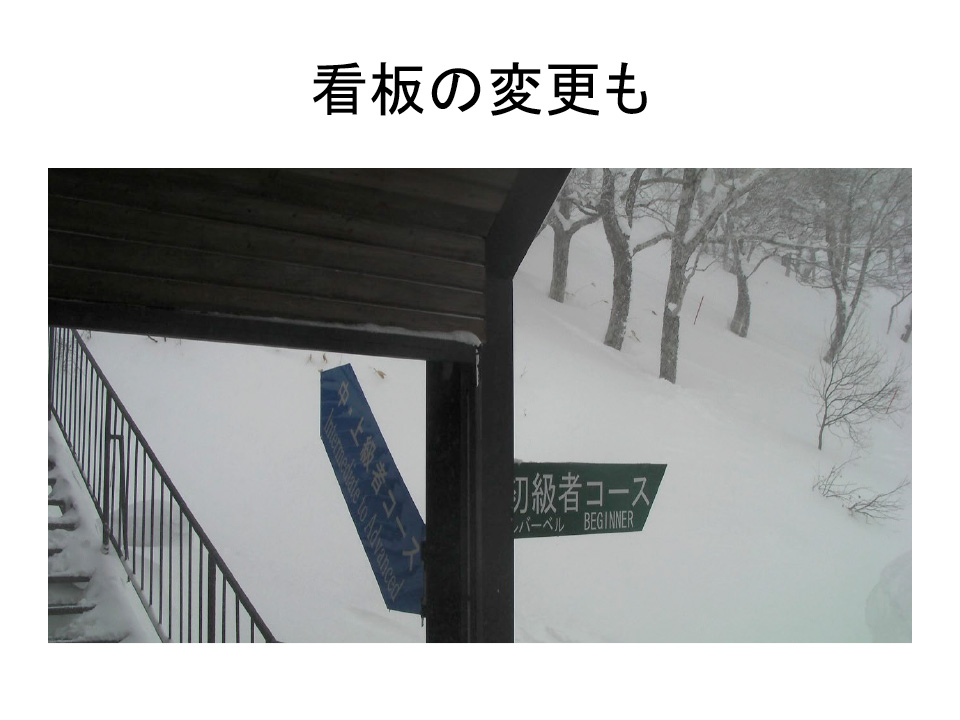
Fixed the level display signboard to make it more enjoyable for a wider range of players
The analysis map below shows the amount of skiing on each course by level, but when comparing the skill level with the skiing logs, we found that even intermediate-level skiers can easily ski on courses that are considered "for advanced skiers."
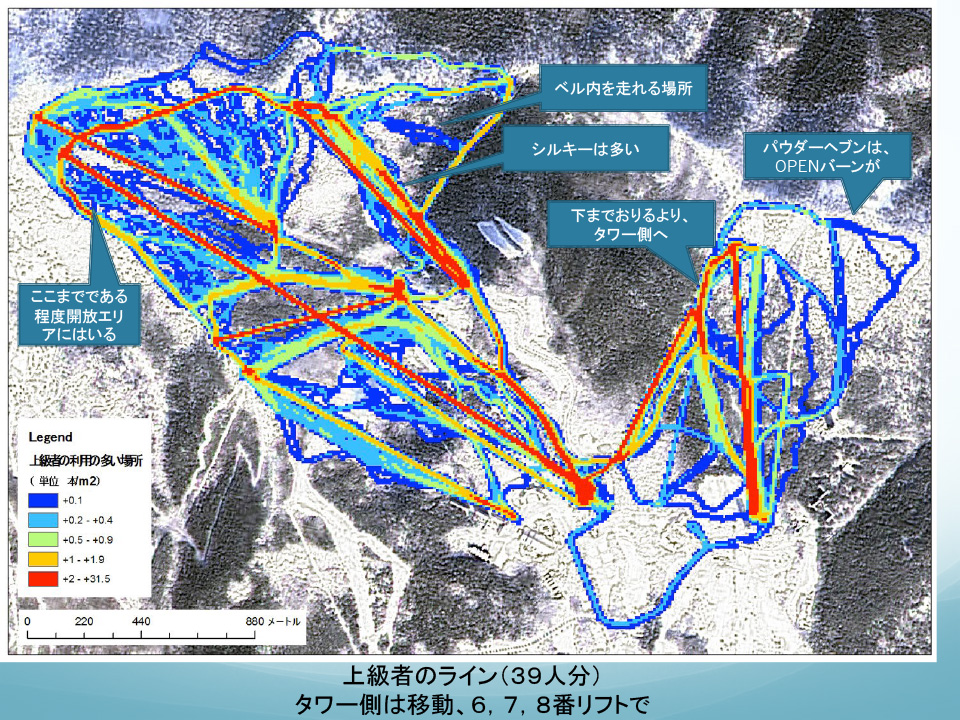
Specifying a level would narrow the options available to users, so we revised the signboard display to offer a more diverse range of options for users to enjoy
This is also an improvement made possible by having analytical data
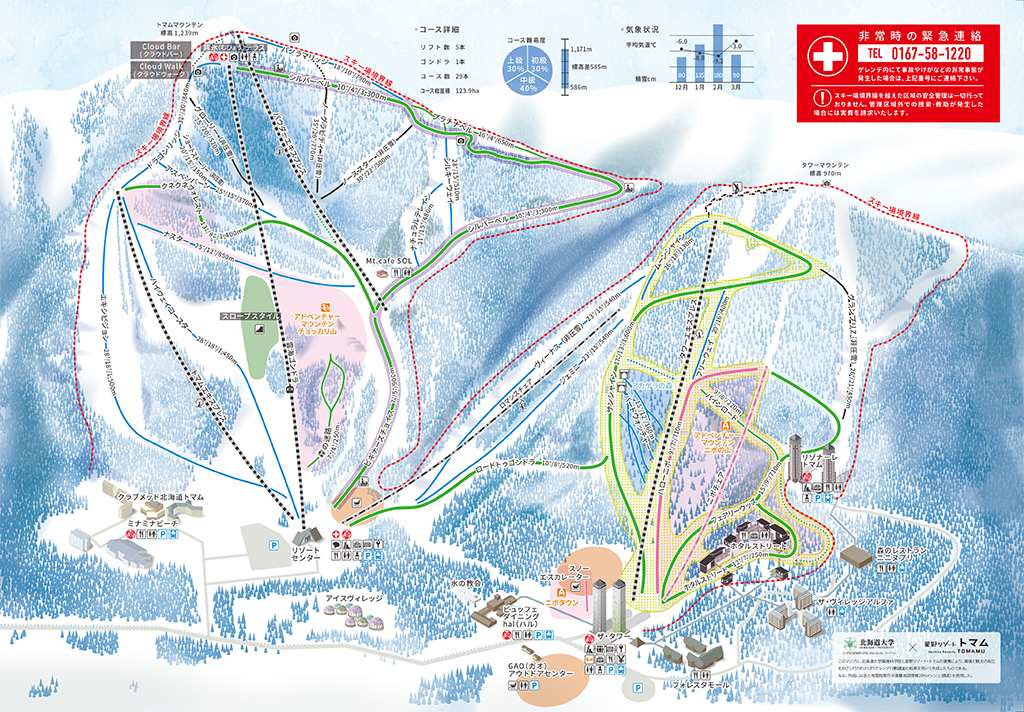
Research findings have completely redesigned the slope map
One major outcome of this research was the complete redesign of Tomamu's slope map. The old slope map had confusing signboards and map representations, making it difficult to understand the connections between courses
However, by tracking the trajectory of a user's run using GPS data, it became clear which fall line the user was skiing on, which in turn allowed for more efficient lift rotation and course routines
The data not only provided information on course connections, but could also be used to express the appeal of the course. The GPS shows the speed of the skiing and the size of the turns. Taking advantage of the fact that the GPS data reflects the mood and atmosphere of the skiing that users are likely to be feeling, we wondered what would happen if we made the map itself easy to understand, and slightly exaggerated to make it look fun
At the time, all involved parties had extensive discussions to ensure that the map included guidance on how to lead people to the location
Incidentally, in the old slope maps, Tower Mountain looked incredibly small. This diminished the sense of scale and the feeling of skiing down it, making the course seem less appealing. Comparing the two maps side-by-side, the difference between Before and After is striking. Tomamu Mountain now appears much larger and more three-dimensional.
"This map wouldn't have been possible without GPS data," commented the person in charge.
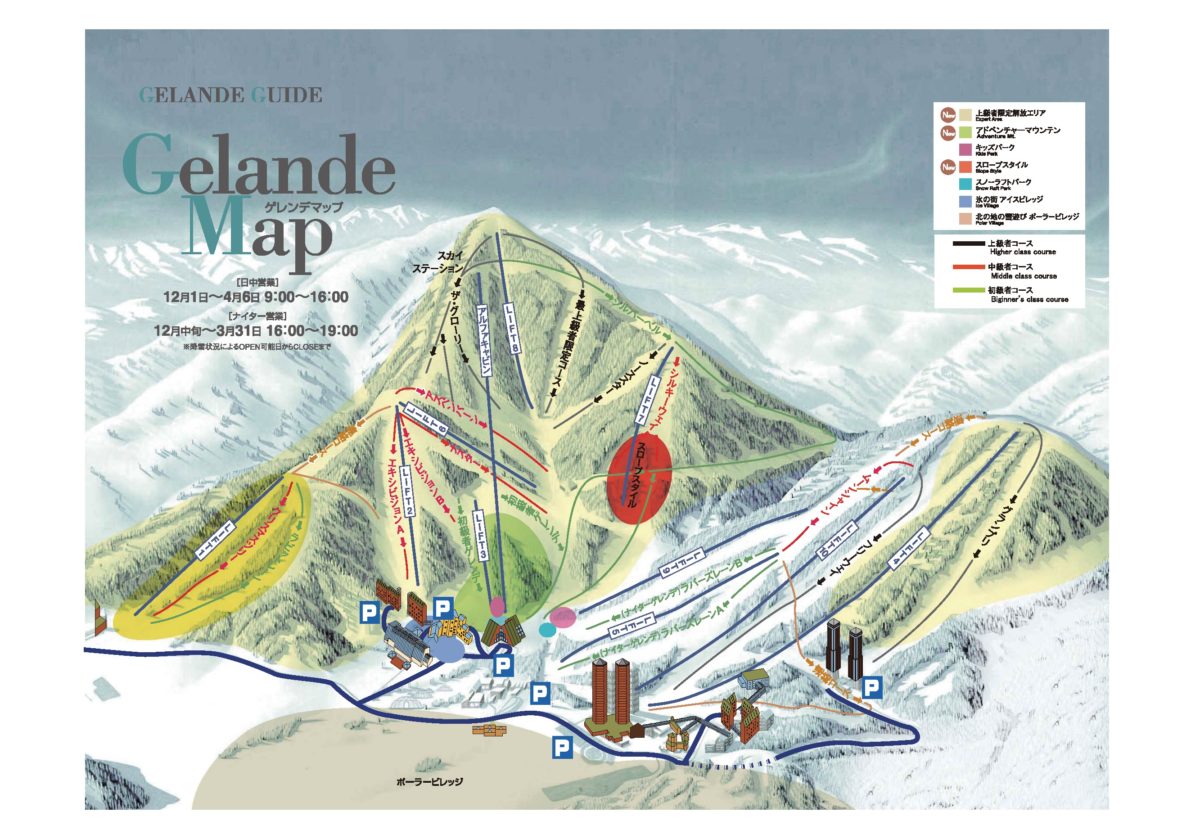
If you look at the Hoshino Resort Tomamu slope map, which is still available on the official website, you will see that it is based on the one that Yoshimura was involved in creating at the time
Navigation is important to ensure that users have the most enjoyment possible. To achieve this, it was essential to review the course maps and signboards. By using GPS and GIS, we were able to visualize and share what users and on-site staff "know" and "feel," which helped to encourage their actions. This was one of the major research results
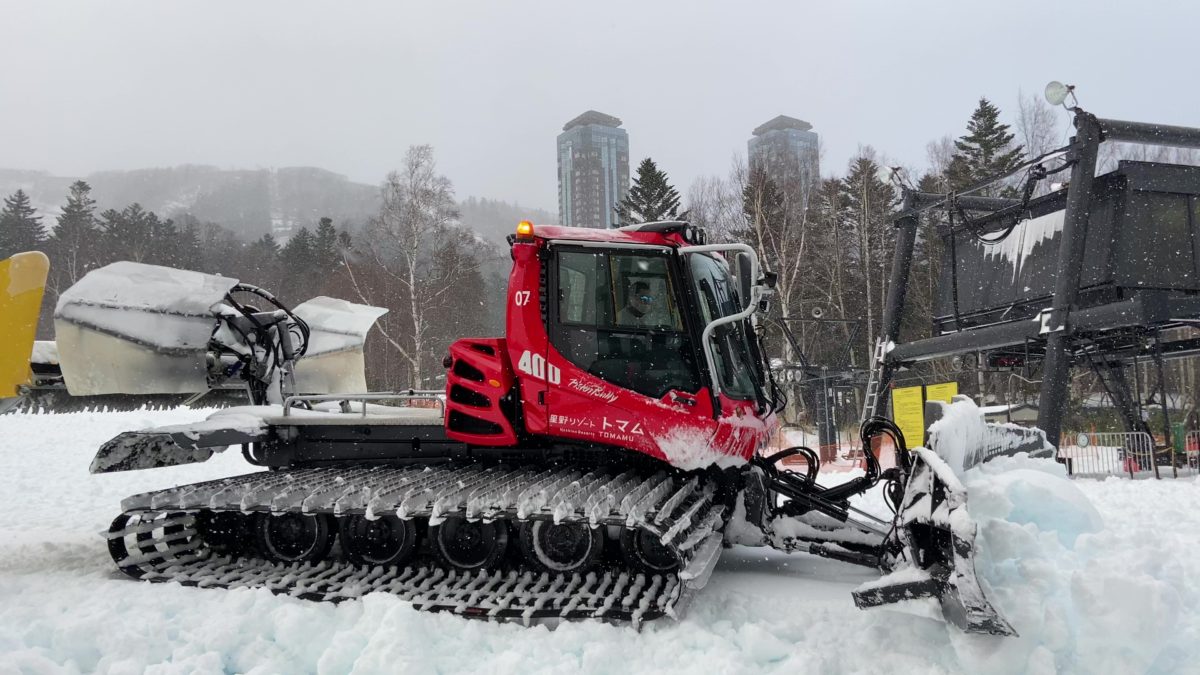
What we learned from snow groomer research
The GPS-based survey was also expanded to include snow groomers. Six snow groomers were fitted with GPS and a daily driving log was collected. Data was collected on how much snow was being groomed on each course, which parts of the course were being groomed, and the time it took to groom the snow. What did they find out?
Increased appeal of skiing through compacted snow and efficient snow groomer operation
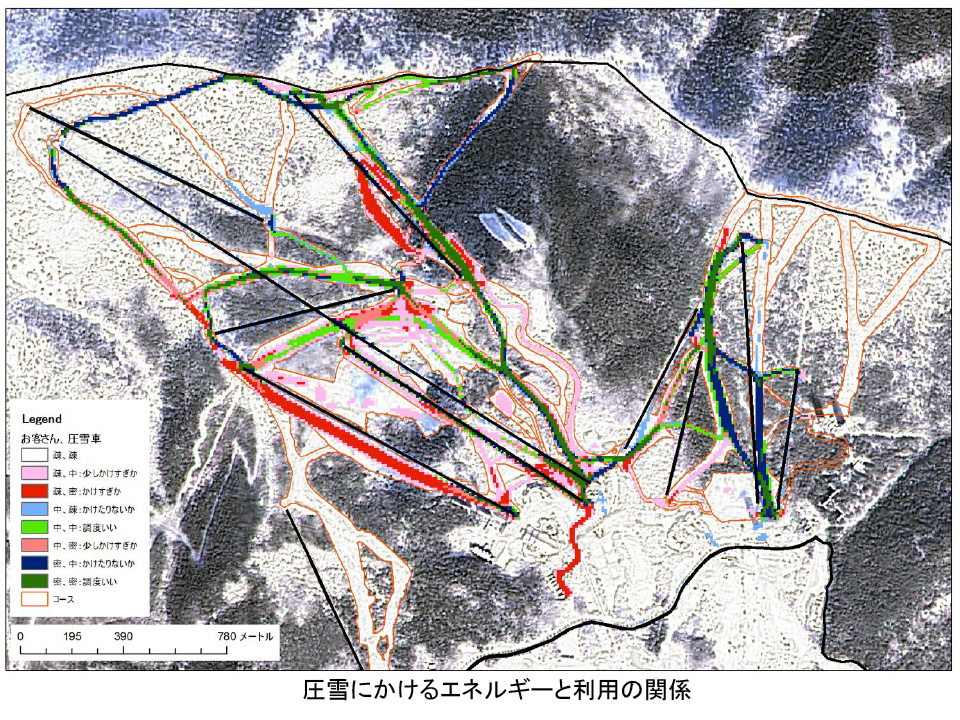
Analysis of the data revealed that excessive snow packing was being applied to areas where it was not necessary, resulting in a waste of fuel and time. As a result of this research, operators reported that they were now able to complete work about 30 minutes faster each day, making a significant contribution to improving work efficiency
Yoshimura saw the following possibilities in this research:
● Find the ideal snow grooming line that seems most efficient
⇒ Eliminating unnecessary grooming will lead to time savings, reduced fuel costs, and reduced labor.
● Find areas that don't need grooming
⇒ Groom according to the user's style. Leaving ungroomed areas for powder enthusiasts or creating lines for intermediate and advanced skiers will increase the appeal of skiing for skiers and lead to increased customer traffic.
● Develop a navigation system
⇒ It would be good to have a system that calculates the most efficient way to drive and allows users to check it inside the snow groomer like a car's navigation system. This will help bridge the gap in skill and experience among snow groomer operators and reduce the cost and time spent on training new recruits.
● Calculate the CO₂ reduction effect
⇒ An environmental initiative. The CO₂ reduction effect can be calculated from the fuel cost of snow grooming. By operating snow groomers efficiently, the CO₂ emitted by the snow groomers can be reduced as a result.
This research was conducted about 10 years ago. It seems to have been way ahead of its time, but there are many aspects of it that are still relevant today. Yoshimura said:
"As the number of skiers and snowboarders declines, the only thing ski resorts can do to improve the enjoyment and satisfaction of skiing is to groom the snow and create trails. You can't change the way the snow falls. So I think it's important to put your heart and soul into creating trails. For example, I think there's something appealing about creating trails that encourage improvement, or that pursue fun and comfort
As an extension of that, I would like to promote tree thinning. Thinning promotes the growth of the entire forest, which increases the amount of CO₂ absorbed. The necessary forest management should be promoted by skiers and snowboarders. At the time, I wasn't thinking much about CO₂, but I thought it would be fun to thin the trees together with the users, and try making something with the thinned wood. I think there is also this kind of communication between ski resorts and users. In the future, I would like to conduct research that matches the needs of the modern era, such as SDGs and CSV."
Hoshino Resorts Tomamu has been working on CSV management from an early stage, and these research examples may provide hints for resorts to aim for CSV management and efforts toward the SDGs in the future
*CSV is an abbreviation for "Creating Shared Value." By incorporating CSV into management and marketing activities, it is seen as a new method for companies to achieve economic success. The key point of CSV is that by solving social issues through the company's core business, it is possible to balance social contribution with corporate profits
The person who taught me

Representative Partner of FiveQuesitionZ LLC,
and Adjunct Associate Professor at Rakuno Gakuen University
Originally from Fukuoka Prefecture, he is currently the representative partner of FiveQuestionZ LLC and an associate professor at Rakuno Gakuen University. He specializes in the use of spatial information technology, including remote sensing, GIS, and GPS. He holds a PhD in Environmental Science and is currently providing technical support for sustainable forest management in developing countries, including a sustainable forest management project in the Solomon Islands. Snowboarding is his life's work. He lives close to a ski resort and snowboards almost every day
Interview cooperation: Hoshino Resorts Tomamu